Wednesday 14:30 UTC is a top-6 weekday half-hour for every single CAD-cross — the closest thing to a Canadian NFP hour comes from a US oil-inventory release
Every single one of the seven liquid CAD-crosses has Wed 14:30 UTC as a top-6 weekday half-hour cell out of 237 per pair. GBPCAD ranks it #2 (behind only Fri 14:30 UTC post-NFP). USDCAD, CADCHF, and CADJPY all rank it #3. The trigger is a US oil-inventory report, but the market reaction happens across every FX pair with CAD on one side of it.
The EIA Weekly Petroleum Status Report is released every Wednesday at 10:30 AM Eastern — 14:30 UTC in DST months, 15:30 UTC in winter. Canada exports roughly 4 million barrels per dayof crude, almost all of it to the US, and Western Canadian Select trades at a discount to WTI. So a weekly US inventory number moves WTI, which moves CAD via the commodity-currency channel — a weekly rhythm the CAD complex inherits whether or not either the base or quote currency’s economy is directly involved. The Fri 12:30-14:30 UTC NFP zone and the Thu 12:30-14:30 UTC ECB/BoE window are the only weekday slots that consistently rank higher.
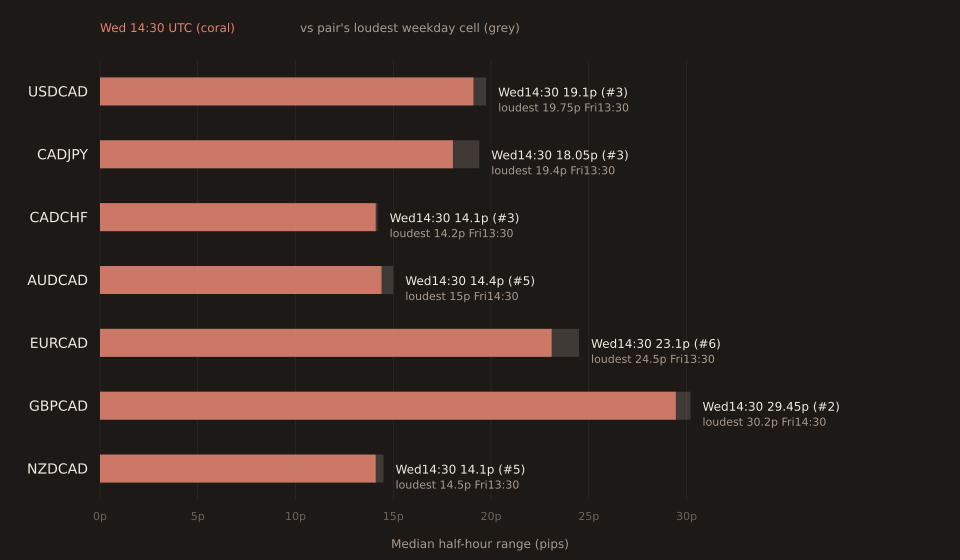
The full ranking table
| Pair | Wed 14:30 UTC | Rank | Loudest cell | Loudest slot |
|---|---|---|---|---|
| GBPCAD | 29.45p | #2 / 237 | 30.20p | Fri 14:30 UTC |
| CADCHF | 14.10p | #3 / 237 | 14.20p | Fri 13:30 UTC |
| CADJPY | 18.05p | #3 / 237 | 19.40p | Fri 13:30 UTC |
| USDCAD | 19.10p | #3 / 237 | 19.75p | Fri 13:30 UTC |
| AUDCAD | 14.40p | #5 / 237 | 15.00p | Fri 14:30 UTC |
| NZDCAD | 14.10p | #5 / 237 | 14.50p | Fri 13:30 UTC |
| EURCAD | 23.10p | #6 / 237 | 24.50p | Fri 13:30 UTC |
For six of the seven CAD-crosses, the Wed 14:30 UTC median range is within 5% of the pair’s loudest weekday cell. Only EURCAD sees a slightly larger gap (23.1p vs 24.5p, about 5.7% below), and it’s still a top-6 cell out of 237. The consistency across every CAD-cross is what makes this a genuine rhythm rather than a one-pair oddity.
What’s in the slots that beat it
The half-hours that rank higher than Wed 14:30 UTC on any given CAD-cross are consistently:
- Fri 13:30 UTC — NFP hour. Loudest cell for USDCAD, CADJPY, CADCHF, EURCAD, NZDCAD.
- Fri 14:30 UTC — Post-NFP hour (see the after-NFP loudness post from 2026-08-08). Loudest cell for GBPCAD and AUDCAD.
- Fri 12:30 UTC — Pre-NFP hour, sometimes contains NFP data (some months the release is at 12:30 UTC due to DST issues on the US side).
- Thu 12:30-14:30 UTC — ECB decision + press conference on ECB days, BoE decision on BoE days.
Wed 14:30 UTC is genuinely the third-loudest scheduled recurring window across most of the CAD complex, sitting just below the two biggest global macro events of the week. This is not a subtle pattern.
How this compares to non-CAD pairs
On non-CAD pairs the Wed 14:30 UTC cell is much further down the rankings — mostly rank 7-13 across the 21 non-CAD pairs. The only exception is GBPAUD, which ranks it #3 — probably a genuine oil effect (Australia is a net oil importer but GBP is the more oil-sensitive leg on the cross via the North Sea) plus the general noisiness that all GBP-crosses share. Across the full 28-pair set, Wed 14:30 UTC is a top-5 cell for 11 of 28 pairs; top-3 for 5 of 28. All four of the top-3 CAD entries plus one non-CAD entry (GBPAUD).
What this doesn’t say
The DST split dilutes the effect. The EIA release is 10:30 AM Eastern year-round, but that maps to 14:30 UTC in DST months (~8 months per year) and 15:30 UTC in winter (~4 months). The Wed 14:30 UTC cell in the tool captures both regimes, so ~4 months of the year the release is happening in the adjacent Wed 15:30 UTC cell instead. That likely understates the true magnitude of the effect. A DST-split analysis would probably show Wed 14:30 UTC as an even louder outlier in DST months.
“Loud half-hour” is not the same as “tradeable”. These figures are typical (median) 30-minute ranges. They tell you that something happens on Wednesday afternoons for the CAD complex — but they don’t say the direction of the move, and range doesn’t equal edge. If you want to trade the EIA release you’d also want to know: how does the direction correlate with the inventory surprise (draw vs build)? What’s the follow-through hour after? Those are questions the News Impact Explorer can answer for events with a consensus number — but EIA inventory isn’t currently in the event list, so for now this Calm Zones view is the best available angle.
Range concentration ≠ liquidity.A high median range on the CAD complex during EIA time can mean the market is actively repricing OR that spreads widen because market makers step back around a scheduled release. In practice on the retail- tier CAD-crosses (EURCAD, GBPCAD, AUDCAD, NZDCAD) the second effect is meaningful — always check your broker’s spread at Wed 14:30 UTC before assuming these ranges are freely capturable.
Open Calm Zones → Free forever. No signup. No email required.