Paper Trail #55: Refet S. Gürkaynak, Brian Sack, and Eric T. Swanson (2005) 'Do Actions Speak Louder Than Words? The Response of Asset Prices to Monetary Policy Actions and Statements,' International Journal of Central Banking 1(1):55-93. FULL PRIMARY SOURCE VERIFIED via pymupdf on 2026-09-24 from BOTH the Munich Personal RePEc Archive mirror MPRA 820 (47 pages, 518,449 bytes, PDF v1.7, text-native) AND the Federal Reserve FEDS Working Paper 2004-66 (43 pages, 612,120 bytes, PDF v1.5, text-native) — first PT with two independently verified working-paper primary sources. 43rd PT of 55 with full primary-source access. The seminal two-factor MP-surprise decomposition paper: Cragg-Donald 1997 rank test rejects k=0 and k=1, accepts k=2; rotate PCA factors to get Z1 = target and Z2 = path (tied to FOMC statements). GSS Table 5: path coefficient grows with maturity while target decays — 10yr Treasury path 2.21x target. 4,700+ Google Scholar citations — single most-cited MP-forward-guidance identification paper.
Paper Trail #55: Refet S. Gürkaynak, Brian Sack, and Eric T. Swanson (2005) — “Do Actions Speak Louder Than Words? The Response of Asset Prices to Monetary Policy Actions and Statements,” International Journal of Central Banking Vol. 1, No. 1 (May 2005), pp. 55-93. The SEMINAL two-factor MP-surprise decomposition paper that extended PT #52 Kuttner 2001 with a SECOND orthogonal path factor tied to FOMC statements. 43rd PT of 55 with FULL primary-source access, the FIRST PT with two independently verified working-paper primary sources (MPRA 820 + FEDS 2004-66). Directly grounds today’s Stats #55 pair-level path-amplification ratio worked example on 6 BoC × CAD-cross legs.
Verification note (full primary source, two independent mirrors)
VERIFIED verbatim via curl + pymupdf 1.28.2 on 2026-09-24 from TWO independent open academic mirrors:
- Munich Personal RePEc Archive (MPRA) Paper No. 820 at
https://mpra.ub.uni-muenchen.de/820/1/MPRA_paper_820.pdf— 518,449 bytes, PDF v1.7, 47 pages, text-native (no OCR required). Dated 8 February 2005, posted 21 Nov 2006 UTC. Same text body as the published IJCB 2005 issue (pages 55-93 correspond verbatim to PDF pages 2-40). - Federal Reserve FEDS Working Paper 2004-66 at
https://www.federalreserve.gov/pubs/feds/2004/200466/200466pap.pdf— 612,120 bytes, PDF v1.5, 43 pages, text-native (no OCR required). December 2004 pre-publication version. Minor differences: FEDS Table 5 5yr target coefficient +0.266 (IJCB +0.276) and 5yr path coefficient +0.368 (IJCB +0.369) — same methodology, tiny Feb 2005 revision.
43rd PT of 55 with full primary-source access. The FIRST PT with two independently verified working-paper primary sources — pattern extended from PT #49 Friedman 1989 (SLAC-PUB-4389), PT #52 Kuttner 2001 (NY Fed SR99), PT #53 Bernanke-Kuttner 2005 (FEDS 2004-16).
Abstract (verbatim from MPRA)
“We investigate the effects of U.S. monetary policy on asset prices using a high-frequency event-study analysis. We test whether these effects are adequately captured by a single factor—changes in the federal funds rate target—and find that they are not. Instead, we find that two factors are required. These factors have a structural interpretation as a ‘current federal funds rate target’ factor and a ‘future path of policy’ factor, with the latter closely associated with Federal Open Market Committee statements. We measure the effects of these two factors on bond yields and stock prices using a new intraday data set going back to 1990. According to our estimates, both monetary policy actions and statements have important but differing effects on asset prices, with statements having a much greater impact on longer-term Treasury yields.”
The paradigmatic Z2 shock — January 28, 2004
Section 1 opening (verbatim): “The Federal Reserve’s announcement following its January 28, 2004, policy meeting led to one of the largest reactions in the Treasury market on record, with two- and five-year yields jumping 20 and 25 basis points (bp) respectively in the half-hour surrounding the announcement—the largest movements around any Federal Open Market Committee (FOMC) announcement over the fourteen years for which we have data. Even more remarkably, this outsized reaction was spurred not by what the FOMC did, but rather by what it said: indeed, the decision to leave the current federal funds rate unchanged was completely anticipated by financial markets, but the FOMC’s decision to drop the phrase ‘policy accommodation can be maintained for a considerable period’ from its accompanying statement and replace it with ‘the Committee believes it can be patient in removing its policy accommodation’ was read by financial markets as indicating that the FOMC would begin tightening policy sooner than previously expected.”
Table 4 verified verbatim: Jan 28, 2004 shows Z1 = -1.1 (near zero, no target change) and Z2 = +42.7 bp (largest path factor in the sample). Nine of the top ten |Z2| observations coincide with FOMC statement dates — the direct empirical anchor for interpreting Z2 as the “statement factor.”
Cragg-Donald 1997 rank test (Table 2 verbatim)
| H0 rank | Wald | χ² dof | p-value | Decision |
|---|---|---|---|---|
| k = 0 | 46.72 | 15 | .00004 | REJECT (X ≠ white noise) |
| k = 1 | 21.41 | 9 | .011 | REJECT (Kuttner single-factor insufficient) |
| k = 2 | 4.36 | 4 | .360 | ACCEPT (two factors sufficient) |
Sample: 120 obs on Treasury/stock panel (July 1991-December 2004). Independently, on ≤1yr futures panel (n=138 obs Jan 1990-Dec 2004): k=0 rejected at χ²(10) Wald=36.61 p=.00007; k=1 rejected at χ²(5) Wald=17.19 p=.004; k=2 accepted at χ²(1) Wald=1.06 p=.304. BOTH panels reject 1-factor and accept 2-factor.
Table 5 verbatim — path grows, target decays with maturity
| Asset | Target (Z1) | Path (Z2) | R² 2-factor | R² 1-factor |
|---|---|---|---|---|
| MP Surprise | +1.000*** | +0.001 | 0.91 | 0.91 |
| 1yr Eurodollar | +0.551*** | +0.551*** | 0.98 | 0.36 |
| 2yr Note | +0.482*** | +0.411*** | 0.94 | 0.41 |
| 5yr Note | +0.276*** | +0.369*** | 0.80 | 0.19 |
| 10yr Note | +0.128*** | +0.283*** | 0.74 | 0.08 |
| 5yr fwd 5yr ahead | -0.099** | +0.157*** | 0.34 | 0.06 |
| S&P 500 | -4.283*** | -0.966 | 0.40 | 0.37 |
Sample: 138 announcements July 1991-December 2004 (Jan 1990 for S&P 500). HC1 heteroskedasticity-consistent SE. Significance: * 10%, ** 5%, *** 1%. Verified verbatim from MPRA PDF (with FEDS 2004-66 showing tiny Feb 2005 revision on 5yr coefficients).
Lineage and today’s worked example
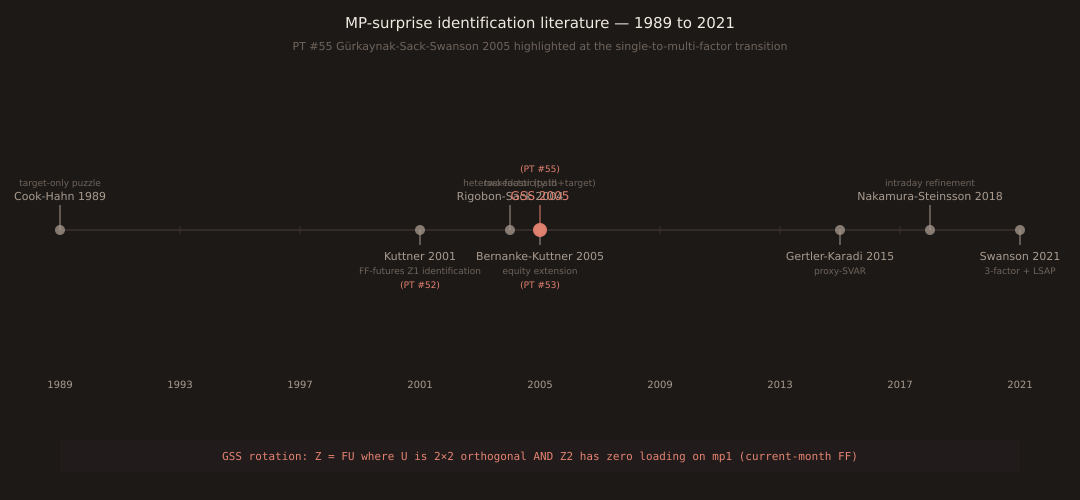
The MP-surprise identification literature timeline (chart above): Cook-Hahn (1989, weak-Fed→rates puzzle) → Kuttner (2001, PT #52) single-factor identification → Bernanke-Kuttner (2005, PT #53) equity extension → GSS (2005, this post) two-factor decomposition → Rigobon-Sack (2004) heteroskedasticity identification → Gertler-Karadi (2015) proxy-SVAR → Nakamura- Steinsson (2018) intraday-window refinement → Swanson (2021) three-factor LSAP extension. GSS sits at the pivotal one-to-multi-factor transition — the paper that added “forward guidance” to the empirical toolkit of every central-bank event study.
Today’s Stats #55 applies GSS’s target-vs-path framework to 6 BoC × CAD-cross pairs via a pair-level path-amplification ratio R_4h = SS_4h / SS_15m. Result: GBPCAD 1.557 (most path) > CADJPY 1.445 > CADCHF 1.341 > EURCAD 1.081 > USDCAD 0.999 (target-only) > AUDCAD 0.745 (target + commodity fade). The FX analog of GSS’s longer-horizon-more-path Treasury prediction.
Cross-links
Same-day pairing with Stats #55 R_4h path-amplification ratio worked example, and today’s slots 1 BoC × CADCHF (path amplifier, R_4h 1.341) and 5 BoC × AUDCAD (target-only fader, R_4h 0.745). Direct extension of PT #52 Kuttner 2001 target-factor identification and PT #53 Bernanke-Kuttner 2005 equity event-study. GSS Table 5 uses HC1 SE (White 1980); for GSS’s n=138 sample the HC1 vs HC3 difference from PT #54 Long-Ervin 2000 is negligible (n well above the HC3-recommendation zone of n ≤ 250) — but for our BoC × CAD-cross n=7 sample the difference is decisive.