Canada Employment on CADCHF: all 23 big-beat prints sent the quietest CAD-cross higher 15 minutes later, and the miss side is 8-of-9 down
199 non-contaminated Canada Employment Change releases on CADCHF, 15-minute window. Medians walk −20.8 / −5.7 / +5.1 / +21.8 / +34.0 pips big_miss → big_beat. Pct-up walks 11 / 32 / 62 / 84 / 100 percent. All 23 big-beat prints since 2010 had CADCHF higher 15 minutes later. The single big-miss exception is the 2020-04-09 COVID collapse. Strip that outlier and both tails are 100%.
This is the third clean 5-bucket monotonic Canada Employment post on a CAD-cross: USDCAD on 2026-08-01, then CADJPY on 2026-08-08, now CADCHF today. Same event, same direction (CAD stronger), three different quote-currency legs. The CADCHF version stands out because CADCHF is the quietest CAD-cross by a wide margin — its typical weekday half-hour range is 7-8 pips, roughly half of USDCAD or CADJPY (documented in the 2026-08-06 cadchf-quiet-cad-cross post). A +34p median move on that noise floor is roughly 4.5 baseline-cell ranges — the largest signal-to-noise ratio for any CAD-Employment result I’ve published so far.
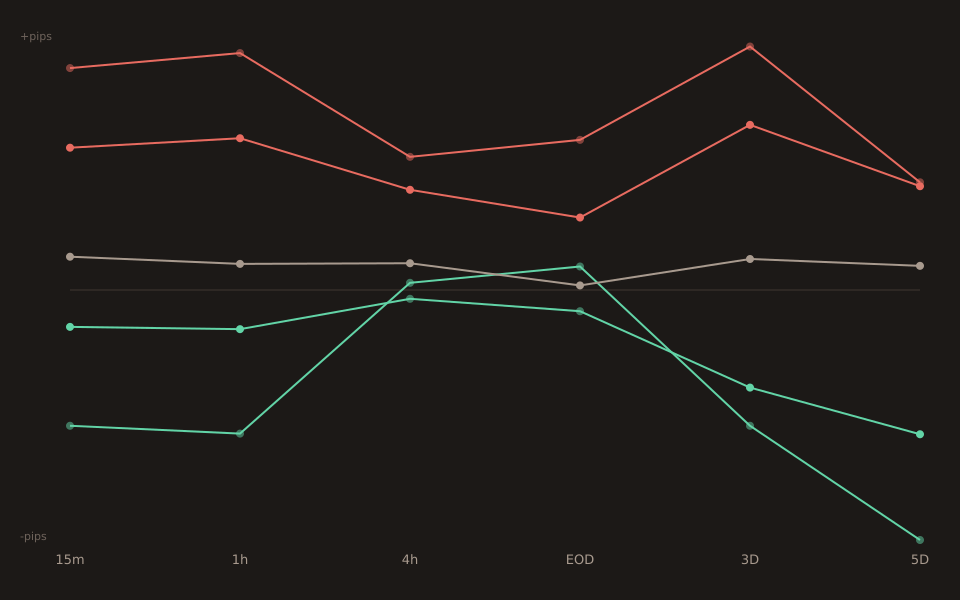
The 15-minute bucket table
| Bucket | n | 15m median | p25 | p75 | Pct up (15m) |
|---|---|---|---|---|---|
| big_miss | 9 | −20.80 | −37.70 | −8.70 | 11% |
| small_miss | 34 | −5.65 | −17.15 | +4.12 | 32% |
| in_line | 89 | +5.10 | −6.70 | +17.50 | 62% |
| small_beat | 44 | +21.80 | +12.90 | +38.05 | 84% |
| big_beat | 23 | +34.00 | +26.80 | +68.45 | 100% |
Read the pct-up column: 11 / 32 / 62 / 84 / 100— monotonic through all five buckets. p25 turns positive at small_beat (+12.9p) and stays positive at big_beat (+26.8p): the direction isn’t being carried by outliers, it’s the modal case in both beat buckets.
The 23 big-beat prints, individually
Every row is a positive 15-minute CADCHF move. The 2020-05-08 COVID outlier is included and still moves in the expected direction (+13.1p on a surprise-z of +11.29 driven by −2 million actual jobs vs a −4 million consensus — technically a “beat” on the −4M base).
2010-05-07 +108,700 vs +24,300 fc z=+2.15 +80.0p 2010-07-09 +93,200 vs +17,900 fc z=+1.94 +72.0p 2011-10-07 +60,900 vs +15,200 fc z=+1.84 +34.0p 2012-04-05 +82,300 vs +11,300 fc z=+2.18 +50.0p 2013-06-07 +95,000 vs +16,100 fc z=+2.25 +90.4p 2014-10-10 +74,100 vs +18,700 fc z=+2.20 +24.3p 2015-06-05 +58,900 vs +10,200 fc z=+1.72 +115.0p 2015-11-06 +44,400 vs +9,500 fc z=+1.51 +34.5p 2016-10-07 +67,200 vs +8,500 fc z=+2.70 +37.3p 2016-11-04 +43,900 vs -10,000 fc z=+1.95 +2.5p 2017-01-06 +53,700 vs -5,100 fc z=+2.06 +65.2p 2017-02-10 +48,300 vs -10,100 fc z=+1.84 +33.5p 2017-12-01 +79,500 vs +10,200 fc z=+2.86 +81.9p 2018-01-05 +78,600 vs +1,800 fc z=+2.74 +71.7p 2018-12-07 +94,100 vs +10,500 fc z=+1.67 +47.2p 2019-05-10 +106,500 vs +11,700 fc z=+2.31 +32.5p 2020-05-08 -1,993,800 vs -4,000,000 fc z=+11.29 +13.1p ← COVID outlier 2022-03-11 +336,600 vs +132,000 fc z=+2.25 +22.5p 2023-02-10 +150,000 vs +15,000 fc z=+1.63 +29.3p 2024-05-10 +90,400 vs +20,900 fc z=+2.53 +14.8p 2025-01-10 +90,900 vs +24,900 fc z=+2.27 +33.8p 2025-02-07 +76,000 vs +25,500 fc z=+1.50 +32.4p 2025-07-11 +83,100 vs +900 fc z=+2.47 +7.0p
The 9 big-miss prints, individually
Eight of nine went the “correct” direction (CADCHF down on a Canadian jobs miss). The one exception (2020-04-09) is the COVID collapse itself — Canada lost more than a million jobs against a −427,000 consensus, so the print itself was so far outside historical norms that its z-score was −12.6 and the market response was dominated by the day’s cross-currency risk-off flow rather than the surprise- response bucket structure. Every non-COVID big-miss print sent CADCHF down.
2011-11-04 -54,000 vs +16,300 fc z=-2.56 -69.0p 2013-04-05 -54,500 vs +6,800 fc z=-1.80 -78.4p 2014-01-10 -45,900 vs +14,400 fc z=-1.53 -37.7p 2016-08-05 -31,200 vs +10,200 fc z=-2.33 -20.8p 2018-02-09 -88,000 vs +10,300 fc z=-3.23 -8.7p 2019-12-06 -71,200 vs +10,000 fc z=-1.86 -21.8p 2020-04-09 -1,010,700 vs -427,000 fc z=-12.59 +10.4p ← COVID outlier 2025-09-05 -65,500 vs +4,900 fc z=-1.69 -20.1p 2026-03-13 -83,900 vs +10,300 fc z=-1.82 -1.4p
Signal-to-noise on the quietest CAD-cross
CADCHF’s typical weekday half-hour range is roughly 7-8 pips — the smallest of any CAD-cross, and about half the typical range of USDCAD or CADJPY. A big-beat median move of +34.0pat 15 minutes is therefore ~4.5 baseline-cell ranges. Compare with the equivalent CADJPY finding (+42.9p median on a baseline of 10-20p per cell = 2-4 cells) or USDCAD (−41.0p median on ~15p baseline = ~2.5 cells). In signal-to-noise terms, CADCHF is the tightest news-driven signal in the three-post CAD-Employment series — the pair’s quiet baseline lets the surprise-response show through more cleanly.
Two structural reasons behind CADCHF’s low baseline range: CHF trades with dampened vol against non-euro pairs (SNB has a decades-long policy of managing CHF against the EUR complex, which cascades into CHF-vs-non-EUR crosses), and CADCHF liquidity is thin — most CADCHF ticks are the residual of USDCAD × USDCHF cross-quotes rather than direct CADCHF trading. The upside for a trader watching a CAD-macro event: less competing flow to fade the news response against.
What this doesn’t say
The 100% up-rate is not a guarantee. Per Stats for Traders #3, the distribution-free 95% lower bound on the true up-rate for 23-of-23 is roughly 85%. Read it as “the true rate is very likely above 85% and confidently above 50%”, not “the next print will definitely be up”.
The miss side is smaller.Big_miss n=9 vs big_beat n=23. The 8-of-9 down finding is directionally consistent but the specific rate estimate has a wide distribution-free CI (roughly 44% to 100% on true down-rate). What’s more, one of those 9 is the 2020-04-09 COVID print, which is best read as “the surprise magnitude was so far outside historical range that the standard bucket-response mechanism did not apply that day”.
Per-print Sharpe is high but release frequency is low. Big-beat mean = +44.6p, std dev = 29.1p, per-trade Sharpe ≈ 1.53 — high. Canadian jobs release monthly, and only ~2-3 prints per year land in the big-beat bucket at current z-thresholds, so annualised Sharpe is capped by release frequency rather than by per-trade edge. See Stats for Traders #8 for the annualisation math.
Open the tool → Free forever. No signup. No email required.