US GDP surprises move gold in the textbook direction — miss up, beat down, monotonic across all five buckets
72 US GDP releases on XAUUSD (gold) since 2010, split into the five surprise buckets. Big miss: median +56 pips at 15 minutes, 88% of prints up. Big beat: median −25 pips, 33% up. Every bucket in between sits in the correct order.
Same directional mechanism as NFP on gold (covered yesterday), on a different macro event class. Growth surprise → real yield re-pricing → gold moves opposite. Just on a quarterly rather than monthly cadence, with somewhat smaller magnitudes because leading indicators have already leaked most of the number by the time GDP prints.
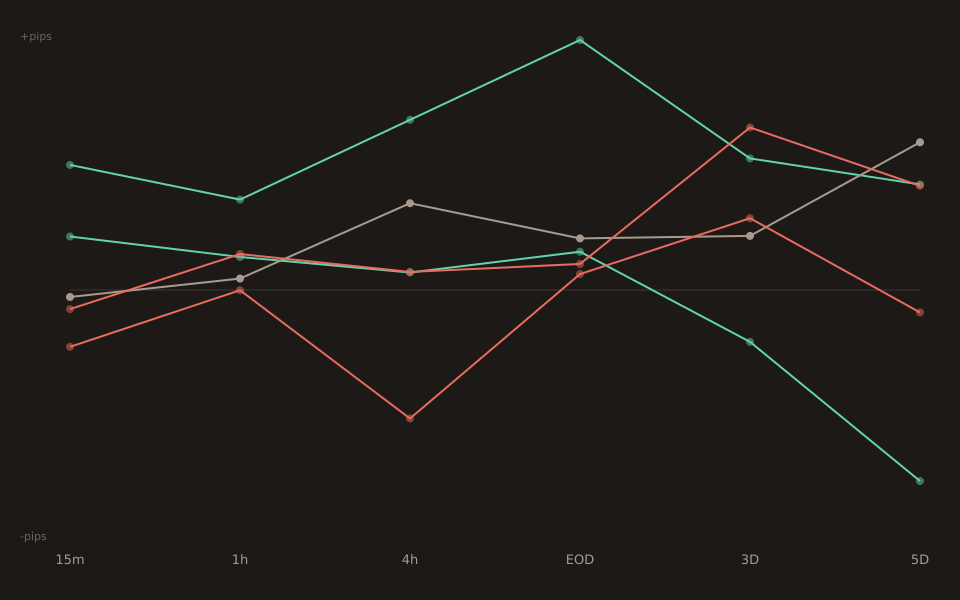
The bucket table
| Bucket | n | 15m median | 1h median | 4h median | Pct up (15m) |
|---|---|---|---|---|---|
| big_miss | 8 | +55.7 | +40.3 | +75.8 | 88% |
| small_miss | 10 | +23.8 | +14.7 | +7.8 | 70% |
| in_line | 31 | −3.1 | +5.1 | +38.7 | 48% |
| small_beat | 14 | −8.5 | +16.0 | +8.1 | 29% |
| big_beat | 9 | −25.3 | −0.1 | −57.2 | 33% |
Read the pct-up column at 15 minutes: 88% and 70% on the miss side; 29% and 33% on the beat side. Seven of the eight big-miss prints saw XAUUSD higher 15 minutes after release; six of the nine big-beat prints saw it lower. The one big_miss that went down was April 2020 (a −4.8% print vs a −4.0%consensus — a COVID-quarter number so wildly out of sample that even a Q1-2020 “beat” came in at −32.9% the following quarter).
Compared to NFP on the same instrument
The natural comparison is the NFP on XAUUSD post from yesterday. Same instrument, same directional response, same underlying real-yield channel; different data cadence and different tail-magnitude scale.
| Bucket | NFP 15m | GDP 15m | Ratio (GDP/NFP) |
|---|---|---|---|
| big_miss | +78.6 | +55.7 | 0.71 |
| small_miss | +56.0 | +23.8 | 0.42 |
| in_line | +2.3 | −3.1 | — |
| small_beat | −49.3 | −8.5 | 0.17 |
| big_beat | −108.3 | −25.3 | 0.23 |
GDP tail-bucket medians are roughly 20-70% of the NFP equivalents. Two mutually-reinforcing reasons.
Leading indicators.Advance GDP is compiled from component data that’s already been released — retail sales, industrial production, trade balance, ISMs — over the quarter. By the time the aggregate lands, most of the number is priced. NFP is one of the first observations of the month’s labour market and doesn’t have that same “leading indicators already told you” problem.
Position-adjustment focus.NFP is the market’s weekly-cycle attention-grabbing event and attracts the most pre-release positioning; the unwind of that positioning post-print is a big chunk of the observed 15m move. GDP has less pre-release positioning to unwind because the market’s attention is more spread out across the quarter.
The middle-window muddle
The 30m and 1h columns don’t look as clean as the 15m one. The small_beat median is +16.0p at 1h — the wrong sign for the bucket. The in_line median is +5.1p at 1h and +38.7pat 4h. What’s going on?
Between 15m and 1h the tape tends to consolidate — position-squaring flow washes back some of the initial-reaction moves before the fundamental re-pricing dominates through the US session. By the 4h window the tail directional signs are back (+76p big_miss median, −57pbig_beat median). The 15m window is where the “event surprise only” is the dominant new information; 30m-1h is where the market is digesting; 4h is where the daily fundamental narrative has reformed. Trade the 15m signal or wait for 4h; don’t rely on 30m-1h to be clean.
The tail outliers
Every tail bucket in this dataset has one huge outlier that exaggerates its median. On big_miss, the January 2013 print of −0.1% versus consensus +1.1% pushed XAUUSD +111 pips in fifteen minutes. On big_beat, November 2013’s 2.8% vs 2.0% pushed gold −128 pipsin the opposite direction. Both are visible in the tool’s p25 and p75 columns as the reason the tail-bucket IQRs are wider than the middle buckets’.
Per Stats for Traders #4, the IQR is what you plan a normal position around; the outlier is what you have to think about before it happens. On the GDP-XAUUSD big_miss bucket the p25/p75 spans [+20.9, +72.5] — a comfortable 50-pip window that captures half of observed outcomes. The outer half stretches from −11.1 to +111.1— 122 pips. If you’re trading a big-miss GDP print on gold, budget for both.
What this doesn’t say
Tail buckets are small. big_miss n=8 and big_beat n=9. Per Stats for Traders #3, the 95% CI on a median at n=8 stretches from roughly min to max of the sample. Trust the sign; be less certain about the exact magnitude.
GDP releases mix Advance / Preliminary / Final. The BEA publishes three vintages of each quarter’s GDP. Advance is the first and gets the most attention; Preliminary and Final are revisions that can also surprise the market. This dataset lumps all three vintages together; individual print behavior at Preliminary or Final may differ from the aggregate pattern.
The COVID quarter is in the sample. Q1 and Q2 2020 are extreme observations by any historical standard. The −4.8% April 2020 print (big_miss) and −32.9% July 2020 print (a big_beat because the consensus was −34.5%) both sit in the data. They contribute to the sample but don’t individually break the bucket direction; the seven other big_miss prints and eight other big_beat prints tell the same story.
Open the tool → Free forever. No signup. No email required.