CADCHF is the quietest of the seven CAD-crosses — typical 30-minute range 7.25 pips, and its loudest cell of the whole week barely beats USDCAD's median
CADCHF’s median weekday 30-minute range is 7.25 pips. USDCAD’s is 9.1p, CADJPY’s is 9.9p, EURCAD’s is 11.85p, GBPCAD’s is 15.0p. Every other CAD-cross is louder than CADCHF. Its single loudest cell of the entire trading week — Friday 13:30 UTC, during the NFP release — prints just 14.2 pips. Which is smaller than GBPCAD’s typical cell.
This is the mirror-image observation to the gbpnzd-loudest-pairpost (2026-08-05), which pointed out that GBPNZD’s quietest cell is louder than the quietest crosses’ loudest cells. CADCHF is the same shape in the opposite direction: its loudest cell barely reaches the activity level that GBPCAD sits at all day, every day.
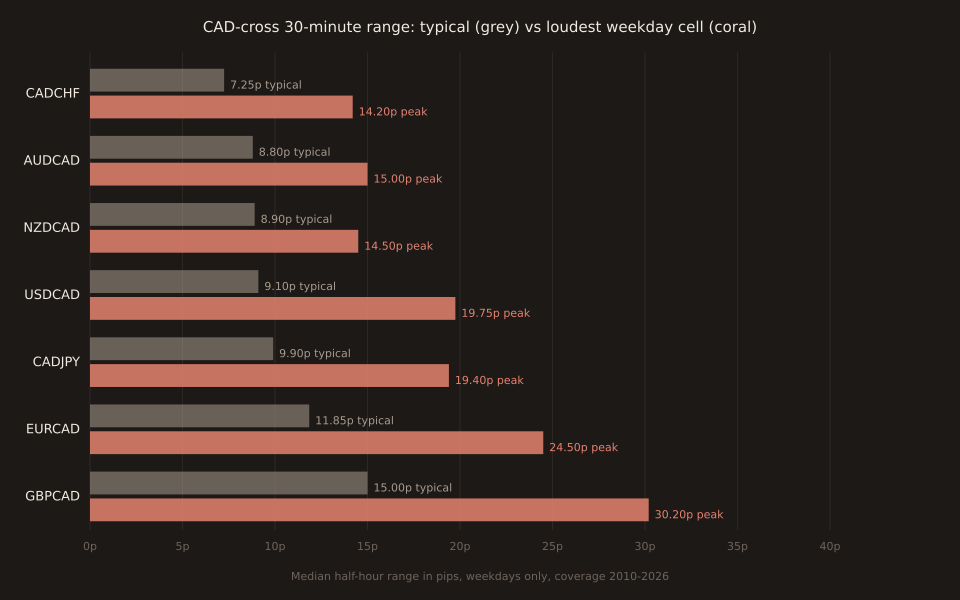
The full CAD-cross activity table
| Pair | Typical cell | Quietest cell | Loudest cell | Peak / typical |
|---|---|---|---|---|
| CADCHF | 7.25 | 3.60 | 14.20 | 1.96× |
| AUDCAD | 8.80 | 6.00 | 15.00 | 1.70× |
| NZDCAD | 8.90 | 5.90 | 14.50 | 1.63× |
| USDCAD | 9.10 | 4.60 | 19.75 | 2.17× |
| CADJPY | 9.90 | 6.00 | 19.40 | 1.96× |
| EURCAD | 11.85 | 6.00 | 24.50 | 2.07× |
| GBPCAD | 15.00 | 7.40 | 30.20 | 2.01× |
Read down the “Typical cell” column: CAD-crosses sit in a rough 7.25p to 15p band, and CADCHF anchors the low end. The peak-vs-typical ratio in the rightmost column is roughly 1.7× to 2.2×across the row — every pair has a similar loud-vs-quiet spread — so CADCHF being tightest on typical directly translates to it being tightest on peak too. That’s the important structural finding: the pair isn’t just low-baseline, it’s low-ceiling as well.
The quiet zone: pre-London Europe
CADCHF’s four quietest cells — Monday 04:00, Monday 04:30, Tuesday 04:00, Wednesday 03:30 UTC — all print median ranges of 3.60 pips. The p90 on those cells sits at 9.0p: nine in ten of the ~800 observed Mondays at 04:00 UTC produced a half-hour candle with a range under 9 pips. That’s CADCHF’s natural sleep window — after Asia has wound down and before Europe wakes up, neither the CAD leg (still dark, Toronto closed) nor the CHF leg (Zurich pre-open) has an active domestic market to price against.
Across the full weekday grid, 23%of CADCHF’s cells (54 of 234) have a median range of 5 pips or less, and 84% (196 of 234) have 10 pips or less. In practical terms: for the great majority of the trading week, the CADCHF chart barely moves.
The loud zone: NFP overlap
The loudest weekday cells for CADCHF — 14.20p — are Friday 13:30 UTC and Friday 14:30 UTC, both in the London/NY overlap and both wrapped around the US Nonfarm Payrolls release. Friday 12:30 UTC is very close at 14.1p, and Wednesday 14:30 UTC (10:30 ET, the EIA weekly petroleum inventory slot) prints 14.1ptoo. Both make sense — NFP moves the USD, which moves USDCAD, which mechanically pulls CADCHF through the CAD leg; and the EIA report moves oil, which moves CAD, which moves CADCHF through the same CAD leg. The pair’s two loudest weekday cells are both external-driver-through-CAD events, neither of them CADCHF-native flow.
Why this specific cross, structurally
Both CAD and CHF are middle-of-liquiditycurrencies — neither is a headline USD/EUR/JPY reserve currency, and neither is a peripheral high-yielder. Both are, in different ways, “quote-side” currencies traders reach for as an exposure sleeve without a strong autonomous flow story:
CAD:flow dominated by USD-Canada (rates, trade balance, oil-linked BOP) and by WTI crude via the petroleum trade balance. Both drivers live on the USD side of any CAD-cross. So CADCHF’s CAD leg only moves when something happens to USDCAD or to WTI.
CHF: flow dominated by SNB policy (quarterly rate decisions, ad-hoc verbal intervention) and by safe-haven demand during risk-off episodes. SNB events are scheduled and infrequent; safe-haven bids arrive on external shocks (equity crashes, geopolitical events). Neither driver lines up with the CAD-side flow schedule.
Result: CADCHF has no calendar of events that move both legs at once. When USDCAD moves on a Canadian CPI print, the CHF leg holds still; when SNB adjusts policy, CAD holds still. The move on one leg gets partially reflected in CADCHF, but with the other leg damped, the net cross move is muted. Add two decades of that structural pattern and you get the quietest CAD-cross in the catalogue.
What this doesn’t say
Quiet isn’t no-risk.CADCHF’s p90 on Friday 13:30 UTC is materially wider than its typical cell. Quiet-baseline pairs can still print outlier candles on the wrong data release; the p90 is where you sanity-check your stop placement, not the median.
Spread costs matter more on quiet pairs. Typical retail CADCHF spreads are 2-4 pips — a bigger fraction of a 7p typical range than a 1-pip EURUSD spread is of a 4p EURUSD cell. Scalping a quiet pair with a wide spread is a losing proposition; the mathematical case for CADCHF is multi-hour holds, not tick-scalping.
Range is not directional predictability.The Calm Zones scan measures typical high-minus-low range within a cell. Low range means “the market doesn’t move around much,” which is different from “the market moves in a predictable direction.” The next step for anyone wanting a directional edge on CADCHF is to layer the News Impact Explorer on top — pick a CAD or CHF release, see what surprise-driven directional move it produces.
Open the tool → Free forever. No signup. No email required.