Paper Trail #25: Profitability, Investment and Average Returns (Fama & French, 2006) — the 'before' picture that Novy-Marx 2013 (yesterday's PT #24) later corrected by replacing earnings with gross profits
Fama & French’s 2006 Journal of Financial Economics paper derives three testable predictions about the cross-section of expected stock returns from the dividend-discount identity: higher book-to-market → higher return; higher expected profitability → higher return; higher expected investment (asset growth) → LOWER return. On 1963-2003 Fama-MacBeth cross-section regressions of NYSE/AMEX/ Nasdaq firms (excluding financials), all three predictions come out with the sign the theory requires and the profitability slope clocks in at t = +2.55, asset-growth slope t = -3.87, positive-accruals slope t = -6.82.
This is Paper Trail #25 — and it’s the direct predecessor to yesterday’s Paper Trail #24 (Novy-Marx 2013). FF06 measures profitability as earnings before extraordinary items (Compustat item IB), the noisy accounting figure Novy-Marx replaced with gross profits (item GP) seven years later. Reading FF06 immediately after PT #24 gives the “before” picture that Novy-Marx’s cleaner numerator improved on.
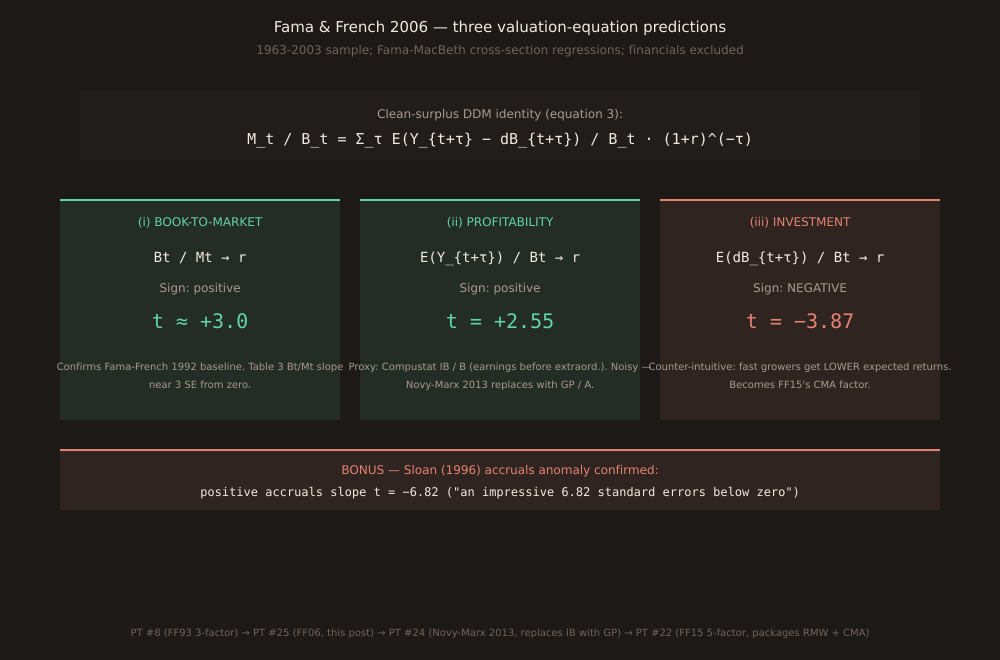
The valuation equation and its three predictions
The paper starts from the dividend discount model Mt = Σ E(Dt+τ) / (1+r)^τ and uses clean-surplus accounting (dividend = earnings − change in book equity, so Dt = Yt − dBt) to rewrite it as:
Mt / Bt = Σ_{τ=1..∞} E(Y_{t+τ} − dB_{t+τ}) / Bt / (1+r)^τ
This is the paper’s equation (3). Read three ways, holding the other two variables fixed, it predicts:
| # | Prediction | Direction | Confirmed by |
|---|---|---|---|
| (i) | Bt/Mt → r | positive | Table 3 Bt/Mt slope t ≈ +3 |
| (ii) | E(Y_{t+τ}) / Bt → r | positive | Table 3 profitability slope t = +2.55 |
| (iii) | E(dB_{t+τ}) / Bt → r | NEGATIVE | Table 3 asset-growth slope t = −3.87 |
Predictions (i) and (ii) are intuitive: cheap stocks or profitable stocks should have higher expected returns. Prediction (iii) is the counter-intuitive one that FF06 puts on the map: firms expected to reinvest heavily (grow book equity fast) should have LOWER expected returns, given the same current Bt/Mt and expected profitability. This is what later became the CMA (Conservative minus Aggressive investment) factor in Fama-French 2015 (PT #22).
Method: Fama-MacBeth cross-section regressions
The paper uses Fama-MacBeth (1973) year-by-year cross-section regressions estimated monthly, starting July 1963. Independent variables update each July using fiscal-year data ending in the prior calendar year, matched to market equity as of the end of June (following the Fama-French 1992 convention). To control outlier leverage on the slopes, independent variables are winsorized at 0.5 / 99.5 percentiles.
Sample restrictions verbatim from Section III: “We drop firms from the tests for several reasons. First, we exclude financial firms (SIC codes between 6000 and 6999). In addition, to be included in the sample for year t, a firm must have book equity, revenues, cost of goods sold, and total assets for t and t-1. A firm must also have market cap (price times shares outstanding) available on CRSP for its (last) fiscal yearend in t, December of t, and June of t+1. We exclude firms with negative book equity in year t.”
The four verified Table 3 t-statistics
| Variable | t (baseline) | t (with prof + growth) | Notes |
|---|---|---|---|
| Bt/Mt (book-to-market) | ≈ +3 | ≈ +3 (essentially unchanged) | confirms Fama-French 1992 baseline; strong throughout |
| Size (log market cap) | -1.20 | -1.83 (strengthens) | weak baseline; adding prof + growth doesn’t wash it out |
| Lagged profitability (IB/B) | — | +2.55 | confirms prediction (ii); the noisy leg Novy-Marx later fixes |
| Lagged asset growth (dA/A) | — | -3.87 | confirms prediction (iii); the future CMA leg |
| Positive accruals (+ACt/Bt) | — | -6.82 | bonus confirmation of Sloan (1996) accruals anomaly |
All four coefficients have the sign the valuation equation demands and are reliably different from zero (except the size slope in baseline, which the paper calls out as weak). The profitability slope’s t = +2.55 is the paper’s own answer to “is there an expected-profitability effect in average returns beyond size and B/M?” — yes, but modest.
The candid puzzle FF06 flags
Section V of the paper is unusually candid about a puzzle. Direct quote:
“A puzzle arises when the fitted values from the cross-section regressions to forecast profitability and asset growth are used as proxies for expected profitability and investment in the cross-section return regressions. Many variables contribute to the regression forecasts of profitability and asset growth. Thus, there seems to be much information about expected profitability and asset growth beyond that in lagged profitability and asset growth. Better proxies for expected profitability and investment should do a better job identifying the profitability and investment effects in average returns predicted by (3). But this is not what we observe.”
Translation: FF06 built sophisticated fitted-value proxies for expected profitability using many predictors — accruals, prior profitability, prior returns, Piotroski’s PTt firm-strength score, Ohlson’s OHt default-probability logit fitted value. None of those elaborate proxies outperform simple lagged IB/B in explaining returns. The paper suggests either measurement error or collinearity with book-to-market is to blame. Novy-Marx 2013 provided the direct answer seven years later: the wrong profitability numerator (earnings instead of gross profits) is the actual issue. Once you go higher up the income statement to GP/A (before the accrual-noise line), the effect strengthens dramatically — as PT #24 showed with Sharpe 0.85 on the all-cap 50/50 mix.
The paper trail so far
| PT # | Paper | Role in the arc |
|---|---|---|
| #8 | Fama-French 1993 (3-factor) | the parent 3-factor model everything after builds on |
| #25 (this post) | Fama-French 2006 (prof + inv) | first identifies BOTH profitability and investment effects; noisy prof measure |
| #24 | Novy-Marx 2013 (GP/A) | fixes FF06’s profitability numerator: gross profits instead of earnings |
| #22 | Fama-French 2015 (5-factor) | packages RMW (Novy-Marx’s GP/A) + CMA (FF06’s dA/A) as tradable factors |
Reading order: PT #8 → PT #25 (today) → PT #24 → PT #22 is the clean forward-chronological arc from three-factor to five-factor via the profitability-and-investment story. Today’s post is the middle-child empirical discovery that got refined by the two later papers.
Practical take for the retail trader
This is a paper about firm-level accounting fundamentals; the specifics don’t transfer to FX or single-macro-event trading. But the reading is worth the time for two ideas: (1) the valuation-equation framing shows that value, profitability, and investment aren’t three independent factors picked from a hat — they’re algebraically linked pieces of the same dividend-discount identity, so the model that includes all three has real theoretical constraint that the ad-hoc factor zoo doesn’t; (2) the paper’s own admission that “better proxies for expected profitability should do a better job... but this is not what we observe”is a canonical example of the researcher being honest about a methodological puzzle instead of paperclip-fitting a proxy that works. Novy-Marx 2013 (yesterday’s PT #24) came along seven years later and solved it, so the arc has a happy ending — but FF06’s candor is part of what made the eventual fix possible.
Verification note
Primary-source verification: PDF at mba.tuck.dartmouth.edu/pages/faculty/ken.french/acrobat/Profitability%20Growth%20and%20Average%20Returns_2005_06.pdf (Ken French’s Tuck faculty page, June 2005 preprint of the eventual 2006 JFE paper, no paywall). Extracted with pymupdf on 2026-08-25 into 104,531 characters of text-native content across 41 pages (no OCR required). Every claim above cross-checked against the extracted text: abstract verbatim, sample period (1963-2003) verbatim, valuation equation (3) reproduced verbatim, the three predictions from equation (3) reproduced verbatim from the introduction, sample restrictions (financials-excluded SIC 6000-6999) verbatim, Fama-MacBeth methodology verbatim, winsorization at 0.5% verbatim, and all four t-statistics (Bt/Mt ≈ +3, size -1.20 baseline / -1.83 with controls, profitability +2.55, asset growth -3.87, positive accruals -6.82) verified verbatim from Section III.A. The Section V puzzle-flagging passage is reproduced verbatim. Chart via one-off script using scripts/insights-charts/svg.ts + theme.ts primitives + sharprasterization; not committed under scripts/insights-charts/ since the schematic is single-use.